
2017-03-29 18:32
1. Industrial production
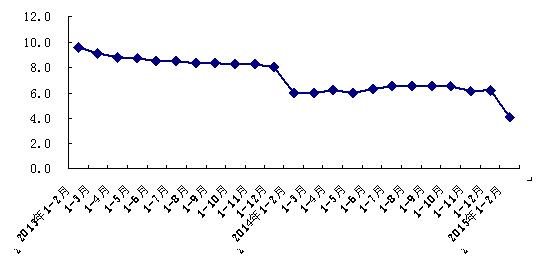
From January to February, the added value of industrial enterprises above designated size is up 4.1% year on year calculated according to the comparable prices. Among them, the growth of computer, communications, and other electronic equipment manufacturing industries, automobile manufacturing industry, and pharmaceutical manufacturing industry were 25.1%, 7.8% and 4.9%, respectively.
Cumulative Growth Rate (%) of Industrial Added Value of Industrial Enterprises above Designated Size since 2013
|
2013年1-2月 |
From January to February 2013 |
|
1-3月 |
From January to March |
|
1-4月 |
From January to April |
|
1-5月 |
From January to May |
|
1-6月 |
From January to June |
|
1-7月 |
From January to July |
|
1-8月 |
From January to August |
|
1-9月 |
From January to September |
|
1-10月 |
From January to October |
|
1-11月 |
From January to November |
|
1-12月 |
From January to December |
|
2014年1-2月 |
From January to February 2014 |
|
2015年1-2月 |
From January to February 2015 |
2. Investment in fixed assets
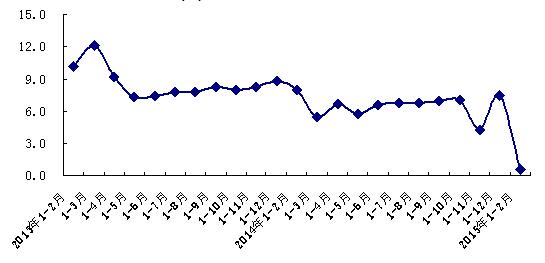
From January to February, the city completed a total social investment in fixed assets of RMB 54.12 billion, up by 0.6% year on year. Among them, the private investment amounted to RMB 20.12 billion, up by 13.1%.
From the aspect of industries, primary industry completed a investment of RMB 120 million, down by 50.2% year on year; the second industry completed a investment of RMB 5.26 billion, down by 17.7%; the third industry completed a investment of RMB 48.74 billion, up by 3.3%.
Cumulative Growth Rate (%) of the Total Social Investment in Fixed Assets since 2013
|
2013年1-2月 |
From January to February 2013 |
|
1-3月 |
From January to March |
|
1-4月 |
From January to April |
|
1-5月 |
From January to May |
|
1-6月 |
From January to June |
|
1-7月 |
From January to July |
|
1-8月 |
From January to August |
|
1-9月 |
From January to September |
|
1-10月 |
From January to October |
|
1-11月 |
From January to November |
|
1-12月 |
From January to December |
|
2014年1-2月 |
From January to February 2014 |
|
2015年1-2月 |
From January to February 2015 |
3. Real estate development and sales
By the end of February, the construction area of the city's commercial housing reached 102.144 million square meters, down by 3.3% year on year; among them, residential property construction area was 49.933 million square meters, down by 8.1%. New construction area of commercial housing this year reached 2.151 million square meters, up by 17.9% year on year; among them, the new residential property construction area reached 947,000 square meters, down by 22.2%.
From January to February, the completion area of the city's commercial housing reached 1.898 million square meters, down by 28.1% year on year; among them, the completed residential property construction area reached 718,000 square meters, down by 48.2%.
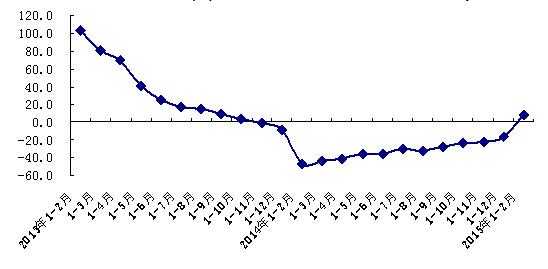
From January to February, the sales area of the city's commercial housing reached 1.15 million square meters, down by 14.6% year on year; among them, the sales area of residential properties reached 970,000 square meters, up by 7.7%.
Cumulative Growth Rate (%) of the Sales Area of Residential Properties since 2013
|
2013年1-2月 |
From January to February 2013 |
|
1-3月 |
From January to March |
|
1-4月 |
From January to April |
|
1-5月 |
From January to May |
|
1-6月 |
From January to June |
|
1-7月 |
From January to July |
|
1-8月 |
From January to August |
|
1-9月 |
From January to September |
|
1-10月 |
From January to October |
|
1-11月 |
From January to November |
|
1-12月 |
From January to December |
|
2014年1-2月 |
From January to February 2014 |
|
2015年1-2月 |
From January to February 2015 |
4. Consumer goods market
From January to February, the total retail sales of social consumer goods in the city reached RMB 160.11 billion, up 7.8% year on year. Among them, the online retail sales of wholesale and retail enterprises above norm reached more than RMB 25.47 billion, up 62% year on year. According to purposes of goods, eating, wearing, and using goods increased by 5.7%, 2.5% and 11.4%, respectively; burning goods dropped by 15.1%. According to consumption patterns, the retail sales reached RMB 147.35 billion, up by 8.1%, and the catering income reached RMB 12.76 billion, up by 4.1%.
Cumulative Growth Rate (%) of the Total Retail Sales of Social Consumer Goods since 2013
|
2013年1-2月 |
From January to February 2013 |
|
1-3月 |
From January to March |
|
1-4月 |
From January to April |
|
1-5月 |
From January to May |
|
1-6月 |
From January to June |
|
1-7月 |
From January to July |
|
1-8月 |
From January to August |
|
1-9月 |
From January to September |
|
1-10月 |
From January to October |
|
1-11月 |
From January to November |
|
1-12月 |
From January to December |
|
2014年1-2月 |
From January to February 2014 |
|
2015年1-2月 |
From January to February 2015 |
5. Price
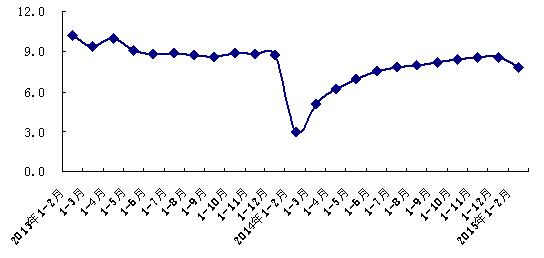
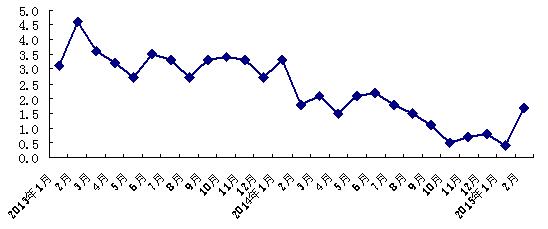
From January to February, the city's general consumer price level rose by 1% on average over the previous year. Among them, food price rose by 0.5%, non-food price rose by 1.2%; consumer price fell by 0.2%, and service price rose by 2.9%. In February, the city's general consumer price level rose by 1.7% over the previous year.
Year-on-Year Change Rate (%) of the Current Month's Consumer Price since 2013
|
2013年1-2月 |
From January to February 2013 |
|
1-3月 |
From January to March |
|
1-4月 |
From January to April |
|
1-5月 |
From January to May |
|
1-6月 |
From January to June |
|
1-7月 |
From January to July |
|
1-8月 |
From January to August |
|
1-9月 |
From January to September |
|
1-10月 |
From January to October |
|
1-11月 |
From January to November |
|
1-12月 |
From January to December |
|
2014年1-2月 |
From January to February 2014 |
|
2015年1-2月 |
From January to February 2015 |
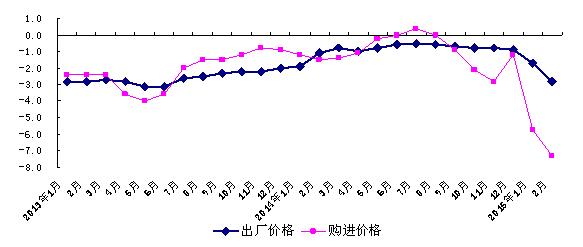
From January to February, the Producer Price and purchase price of the city's industrial producers went down by 2.3% and 6.5% year on year respectively. In February, the Producer Price and purchase price of the city's industrial producers went down by 2.8% and 7.3 % year on year respectively.
Year-on-Year Change Rate (%) of the Producer Price and Purchase Price of the City's Industrial Producers since 2013
|
2013年1-2月 |
From January to February 2013 |
|
1-3月 |
From January to March |
|
1-4月 |
From January to April |
|
1-5月 |
From January to May |
|
1-6月 |
From January to June |
|
1-7月 |
From January to July |
|
1-8月 |
From January to August |
|
1-9月 |
From January to September |
|
1-10月 |
From January to October |
|
1-11月 |
From January to November |
|
1-12月 |
From January to December |
|
2014年1-2月 |
From January to February 2014 |
|
2015年1-2月 |
From January to February 2015 |
|
出厂价格 |
Producer Price |
|
购进价格 |
Purchase Price |